Navigating the Affordable Housing Investment Landscape
With over 7 million affordable homes needed nationwide, investors are confronting a critical question: can you meaningfully address the housing crisis and earn compelling returns?
April 8, 2025

Introduction
The affordable housing sector has garnered significant interest from investors worldwide as many countries are facing a shortage of affordable housing units available to middle- and low-income households. In particular, it is estimated that there is a shortage of 7.4 million affordable units in the United States [1].
Defining the Affordability Crisis
Over the past 20 years, the United States’ population has grown by more than 43 million individuals and future growth projections remain strong [2]. Despite the growing population, the country has underbuilt housing by several millions of homes over the last 15 years which has significantly impacted housing affordability. Furthermore, exponential growth in home prices has priced many individuals out of homeownership as household income growth has dramatically lagged the increase in home prices. Elevated mortgage rates have created an additional challenge for buyers as they are required to bear a higher monthly cost to own their home.
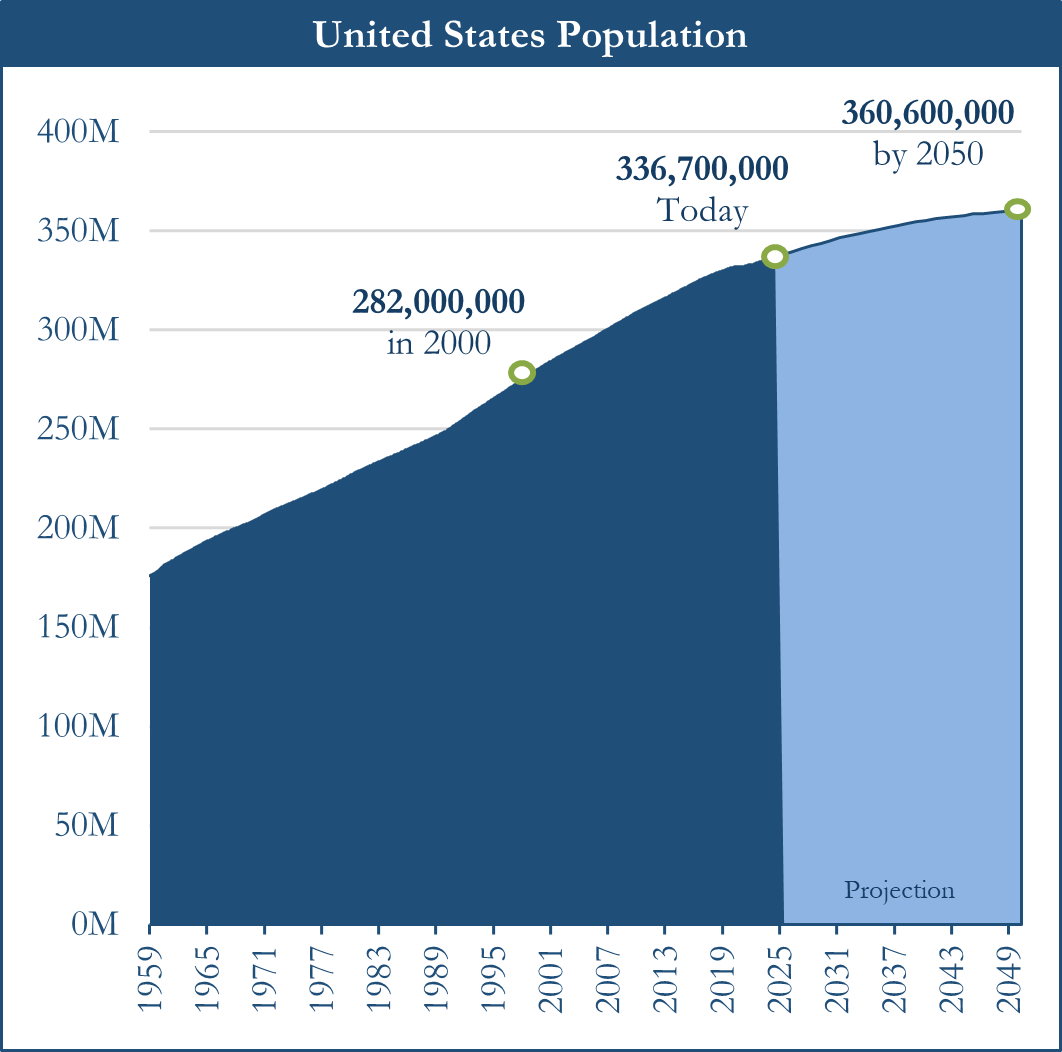
Source: U.S. Bureau of Economic Analysis
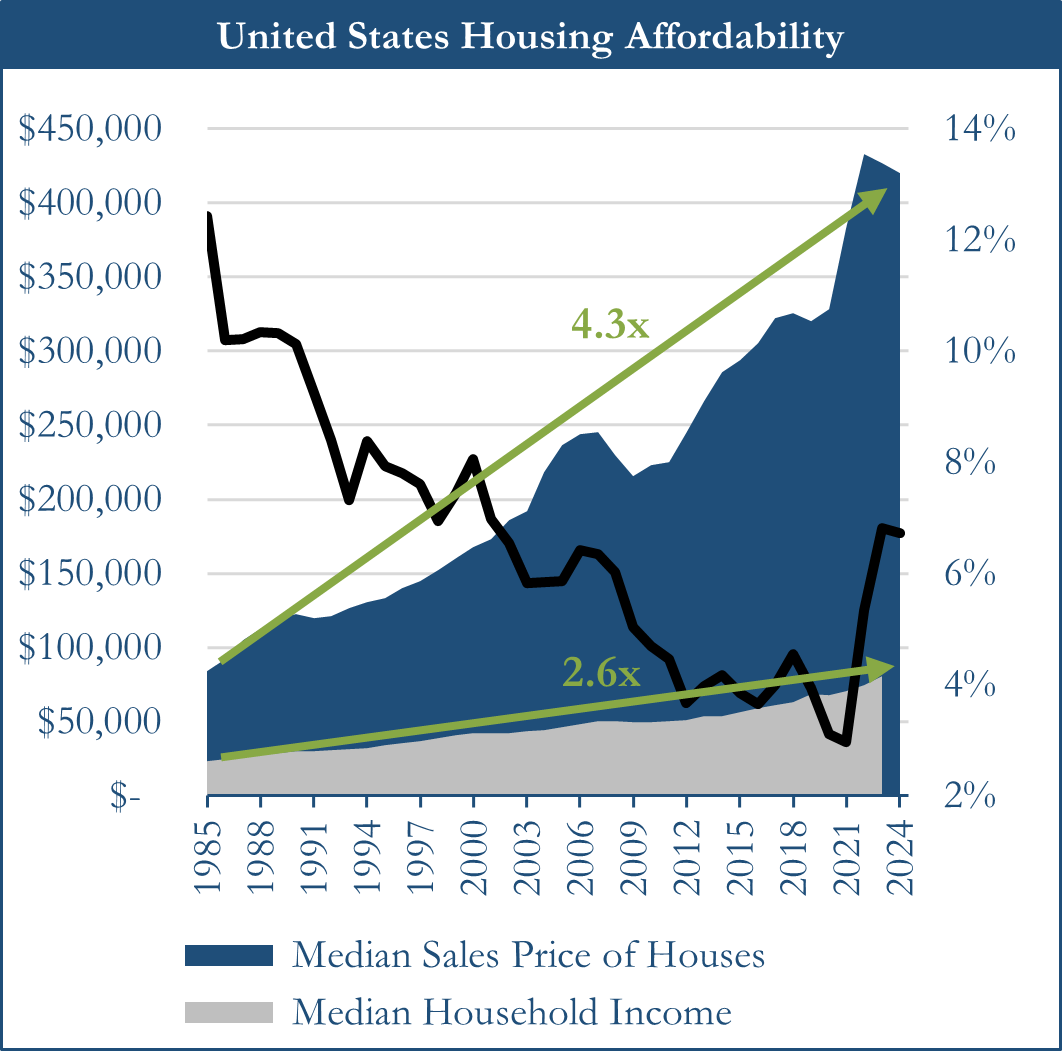
Source: U.S. Census Bureau; U.S. Department of Housing and Urban Development; Median Household Income data as of 2023
Housing is considered to be affordable when a household spends no more than 30% of its pre-tax income on housing costs, including rent or mortgage payments, property taxes, insurance, utilities and maintenance [3]. Affordable housing is intended to ensure that households have enough income remaining for other essential expenses such as food, transportation, health care and education. As demonstrated in the following chart, the United States population is facing a detrimental housing cost burden as many households spend more than 30% of their income on housing costs. Additionally, the burden is assumed to be severe when a household spends more than 50% of its pre-tax income on housing costs [4]. Many residents of two of the most densely populated states, California and Florida, are challenged by severe housing cost burdens. On average, 49.7% of all renter occupied households are cost burdened [5].
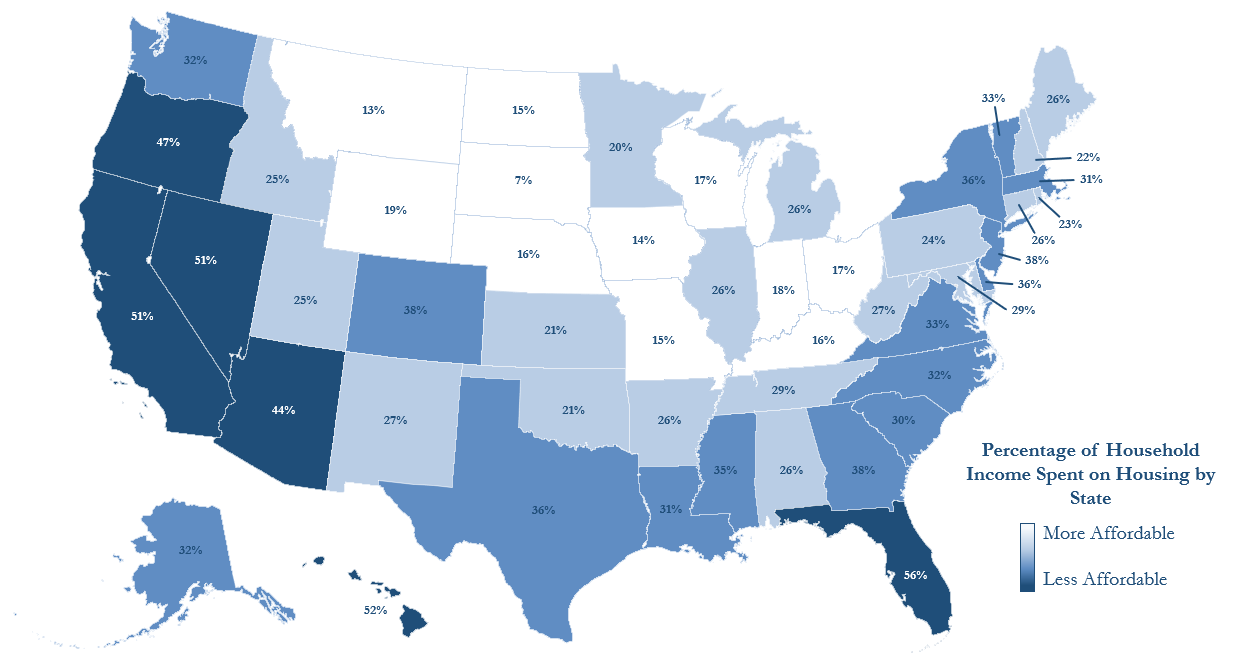
Source: NLIHC tabulations of 2021 ACS PUMS data; Chamber of Commerce, 2023. Map shows the severe housing cost burden across states; greater than 50% income spent on rent.
Area Median Income (“AMI”) is calculated by the Department of Housing and Urban Development (“HUD”) to determine the annual income eligibility requirements of federally assisted housing programs such as Public Housing, Section 8 tenant-based vouchers and Section 8 project-based vouchers. HUD considers households to be low-income if combined household income is less than 80% of AMI and extremely low-income if combined household income does not exceed 50% of AMI [6].
As of 2024, there were more than 147.4 million housing units in the United States comprised of 86.9 million owner occupied units, 45.5 million renter occupied units and 15.0 million vacant units [7]. Within rental housing, there are only 5.1 million subsidized units [8] that are meant to serve approximately 50 million low-income households [9] and 10.9 million extremely low-income households [10]. Although the number of vacant units may appear to be a solution to the lack of affordable housing, these units predominantly consist of vacation homes and new construction that has not yet been occupied. As a result, the true vacancy of housing units in the United States is lower than what the nominal vacancy rate would suggest.
Due to expiration of rent restrictions, obsolescence and underproduction, the deficit of 7.4 million affordable units available to low- and extremely low-income households is projected to increase to a national shortage of 8.2 million units by 2032 [11].
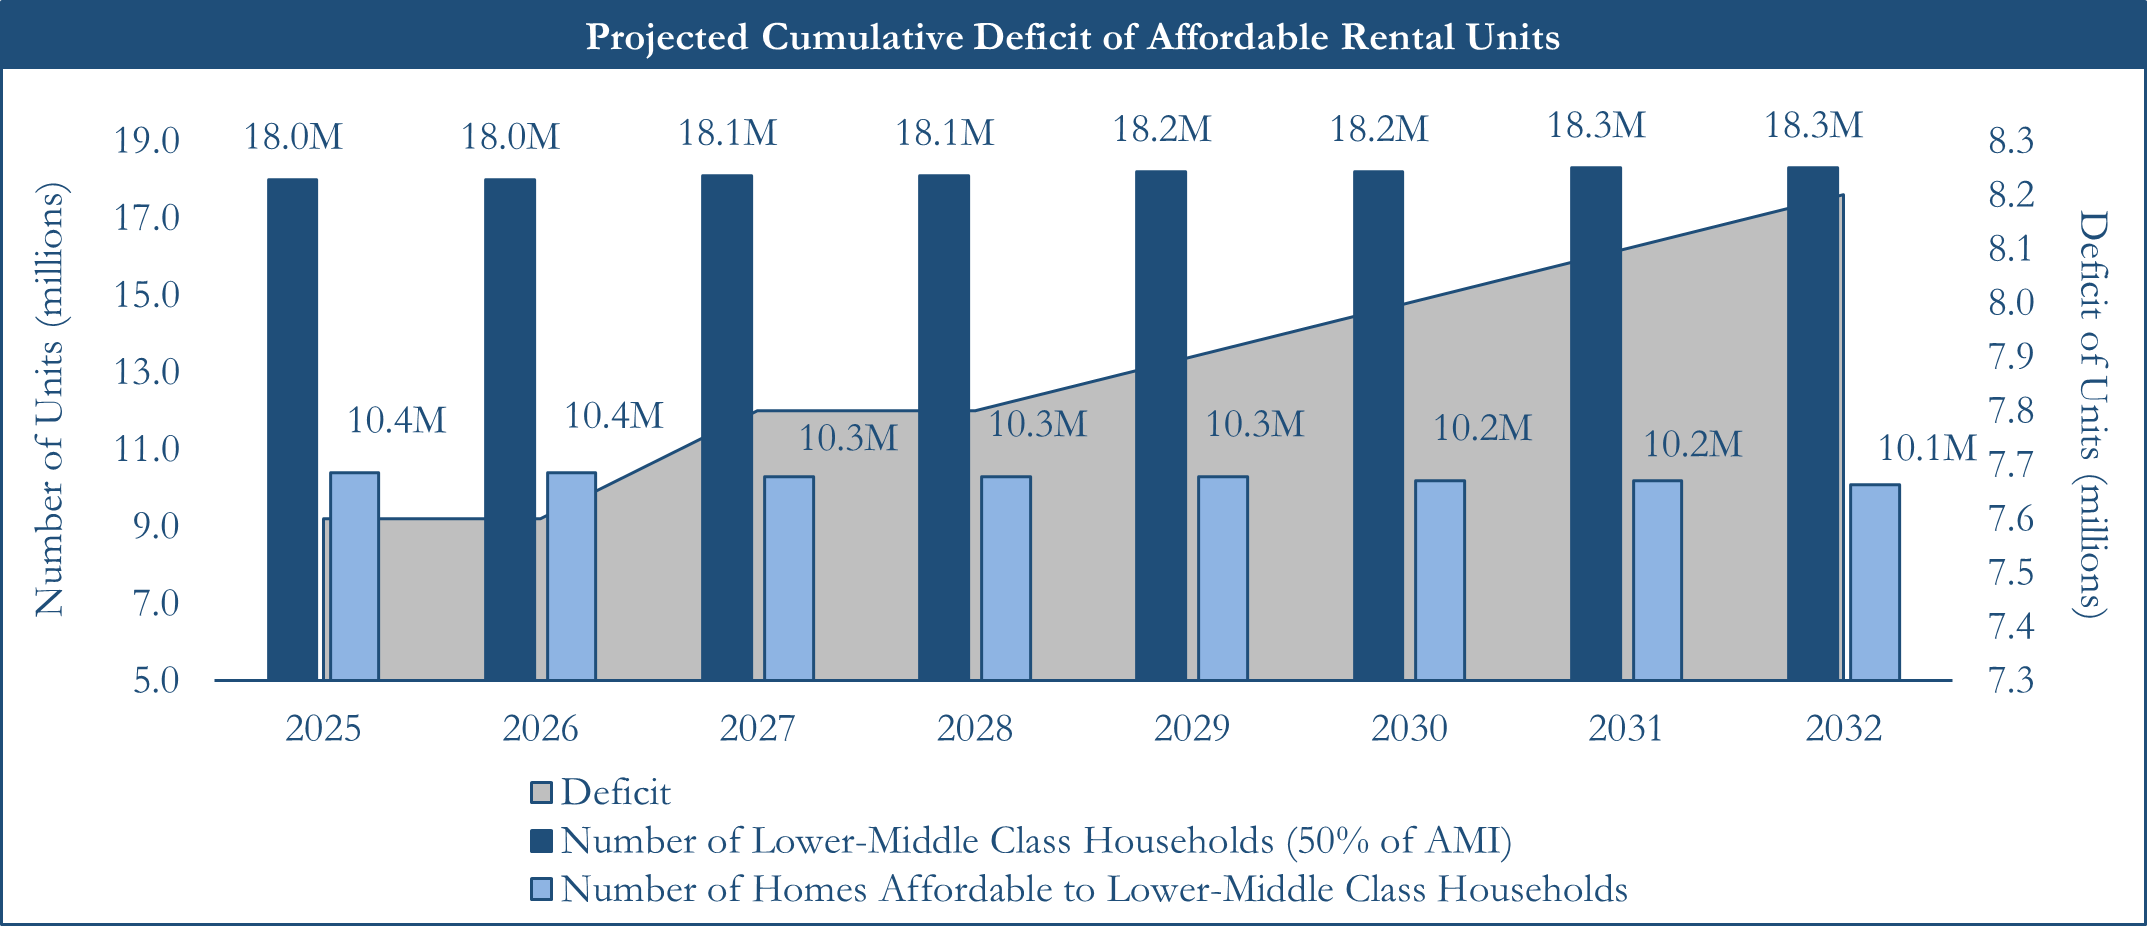
Source: National Low Income Housing Coalition
Housing Eligibility Associated with Household Income Level
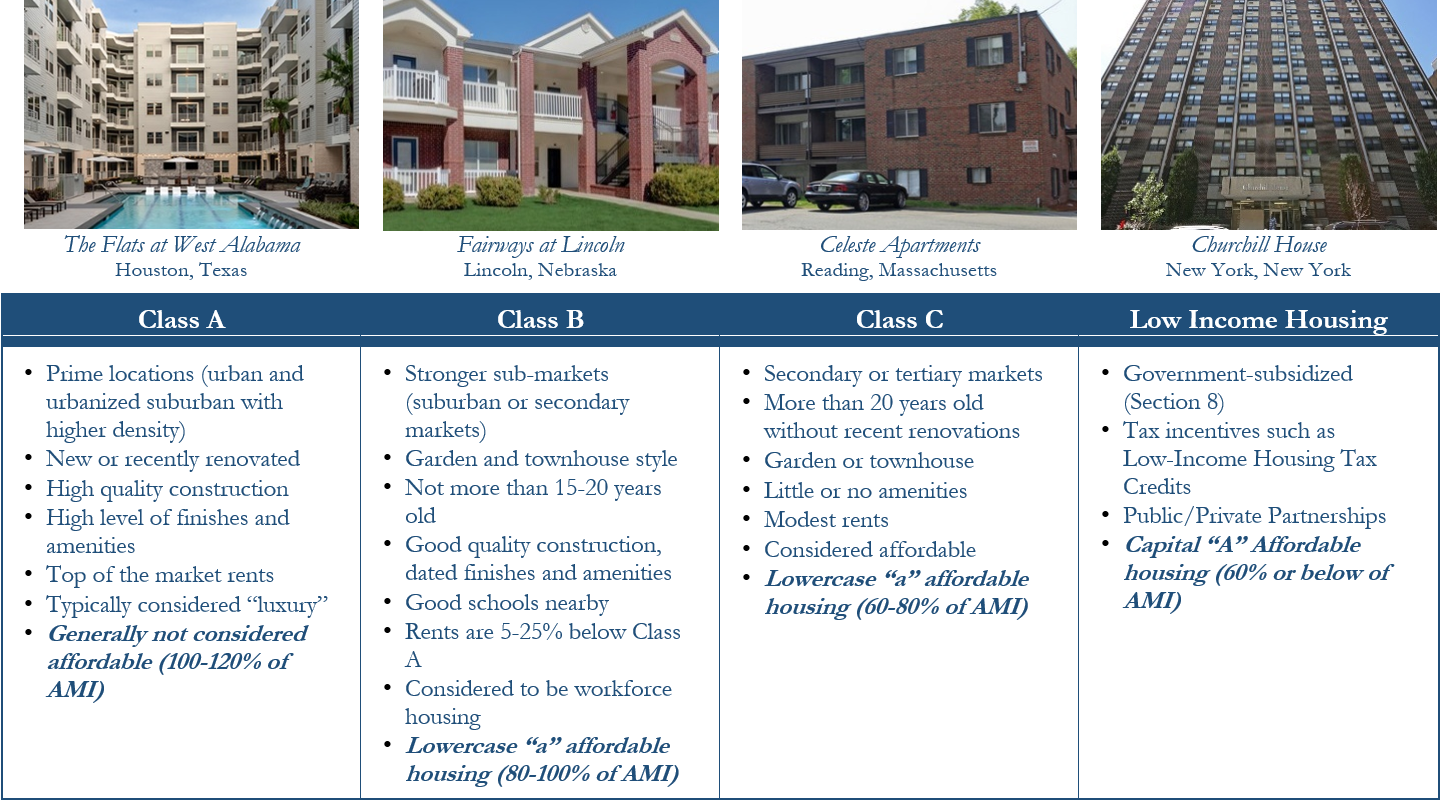
Multifamily assets are classified based upon several factors that determine the asking market rent. Because Class A and Class B rental housing demands higher market rents, households with lower income levels are often priced out of higher quality housing.
As shown by the charts below, many renter households are only able to reasonably afford low income and Section 8 housing based upon their median household income. Conversely, the median household income of homeowners is significantly higher allowing homeowning families to comfortably afford Class A units.
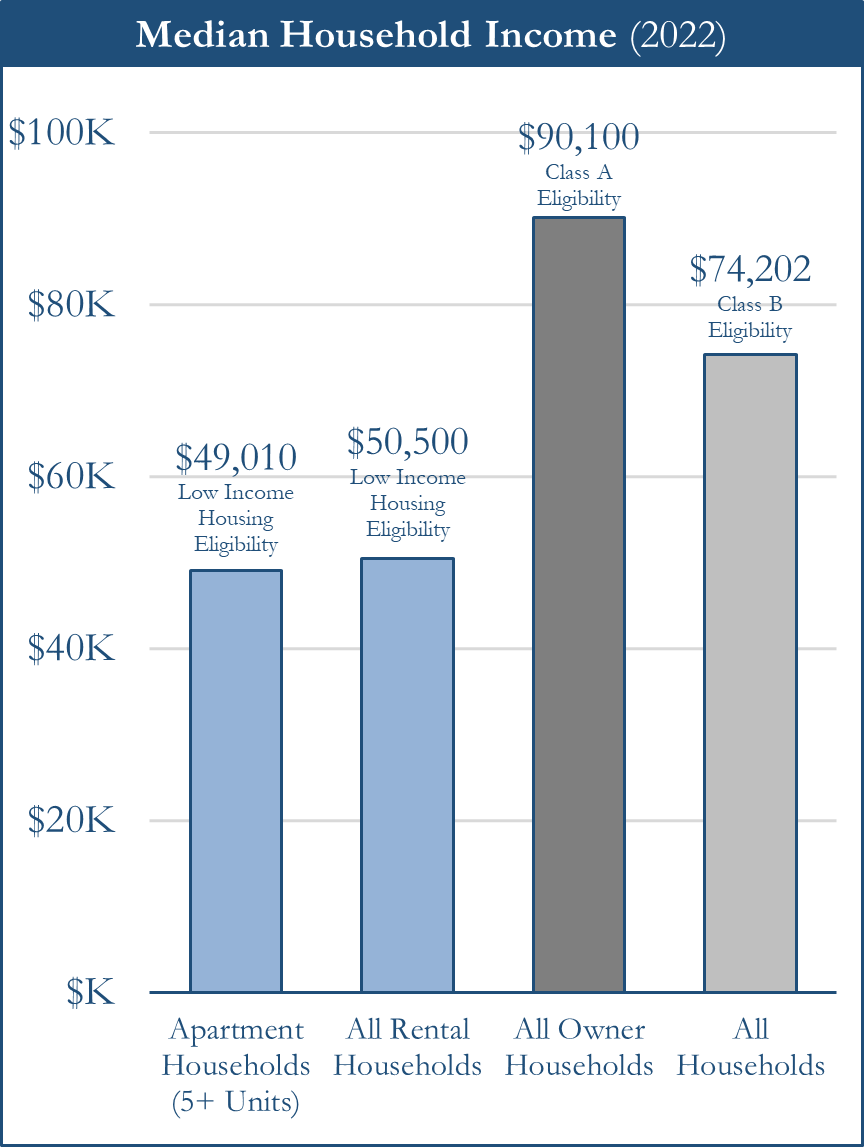
Source: National Multi Housing Council (NMHC) and U.S. Census Bureau, American Community Survey 2022
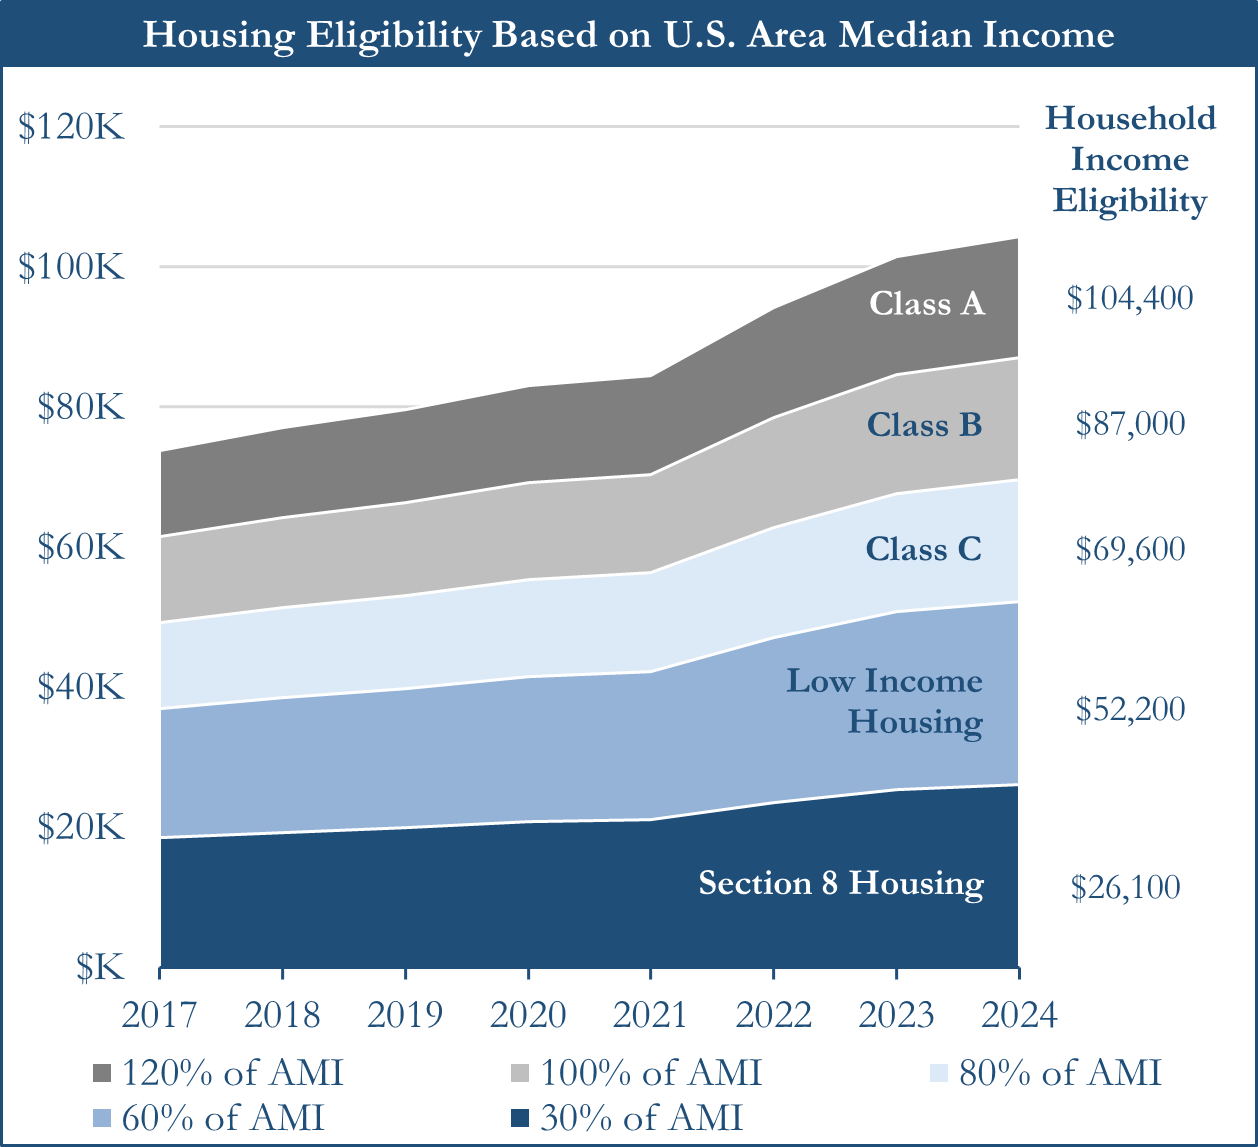
Source: Office of Policy Development and Research HUD User
When investors think of affordable housing, they often recall details on government-subsidized housing through programs such as Section 8 and Low-Income Housing Tax Credits. However, it is important to distinguish the difference between Affordable housing and affordable housing. Many sector experts refer to government-subsidized housing as “capital A” Affordable while workforce and naturally occurring affordable housing such as Class B and Class C units is referred to as “lowercase a” affordable housing.
Governmental Policy Tools for Improving Housing Affordability
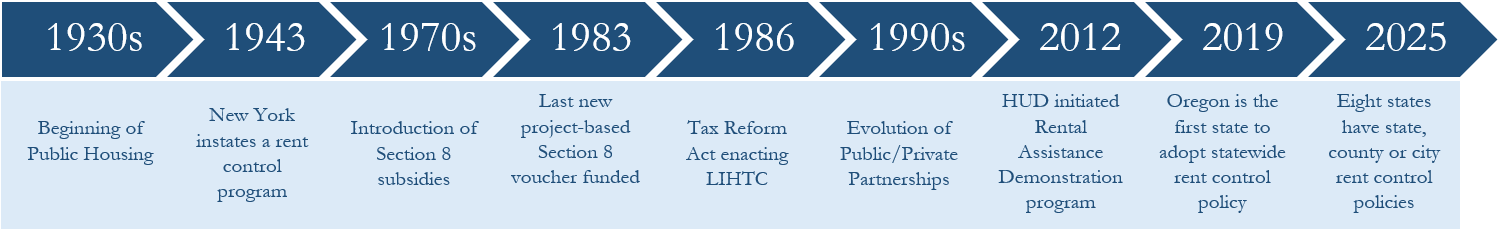
The government began developing policies to aid in the affordable housing crisis in the 1930s. Over time, policy and programs have evolved and continue to expand with increasing governmental funding.
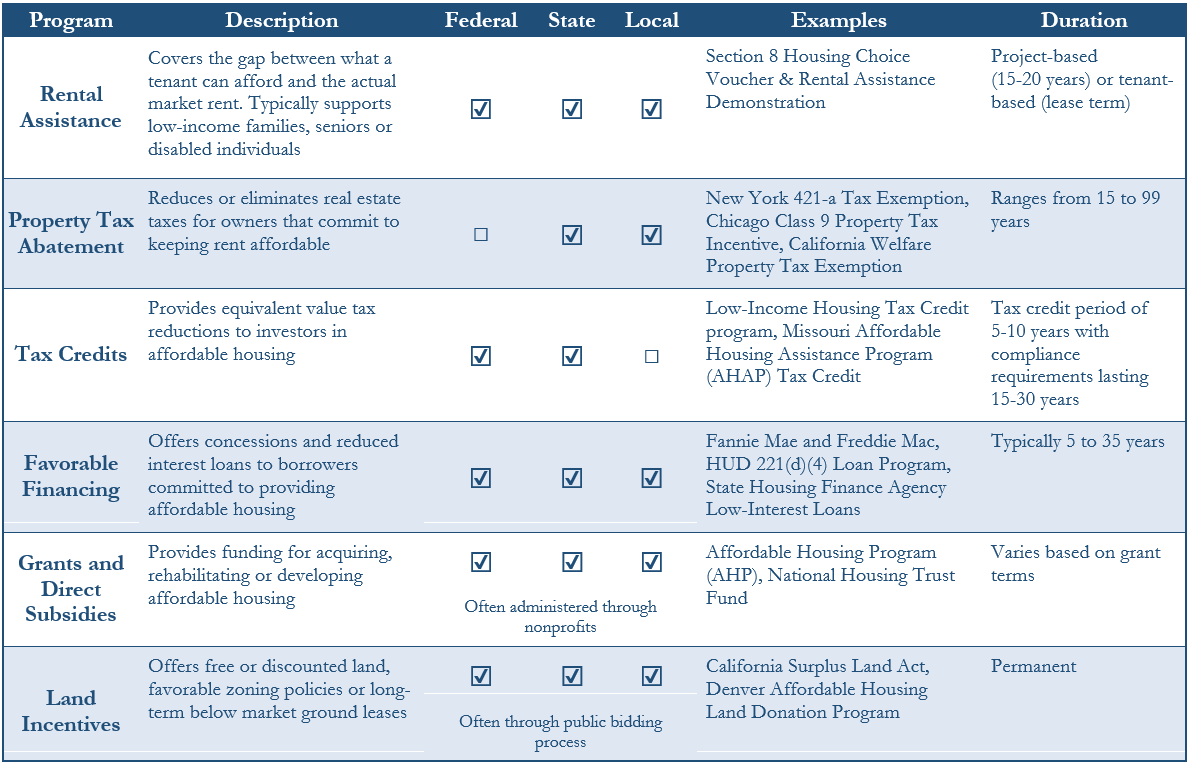
All levels of government offer a variety of programs to support affordable housing. Despite these efforts, the demand for affordable housing continues to outpace available resources.
The following table displays various governmental programs created to improve housing affordability.
The Most Effective Governmental Policy Tool: Low-Income Housing Tax Credit
The Low-Income Housing Tax Credit (“LIHTC”) program, which was enacted as part of the Tax Reform Act of 1986, has been the most effective policy to increase the supply of affordable housing. The public/private partnership is a tax credit that subsidizes a portion of the costs associated with acquisition, construction and rehabilitation of affordable rental housing and supports the construction or rehabilitation of approximately 110,000 affordable rental units each year [12]. LIHTC has assisted in the creation of more than 4 million units and has served more than 9 million households since its inception [13]. With the significant rise in development costs in conjunction with an estimated 350,000 LIHTC units expiring by 2030 [14], it is becoming increasingly difficult to add more affordable supply.
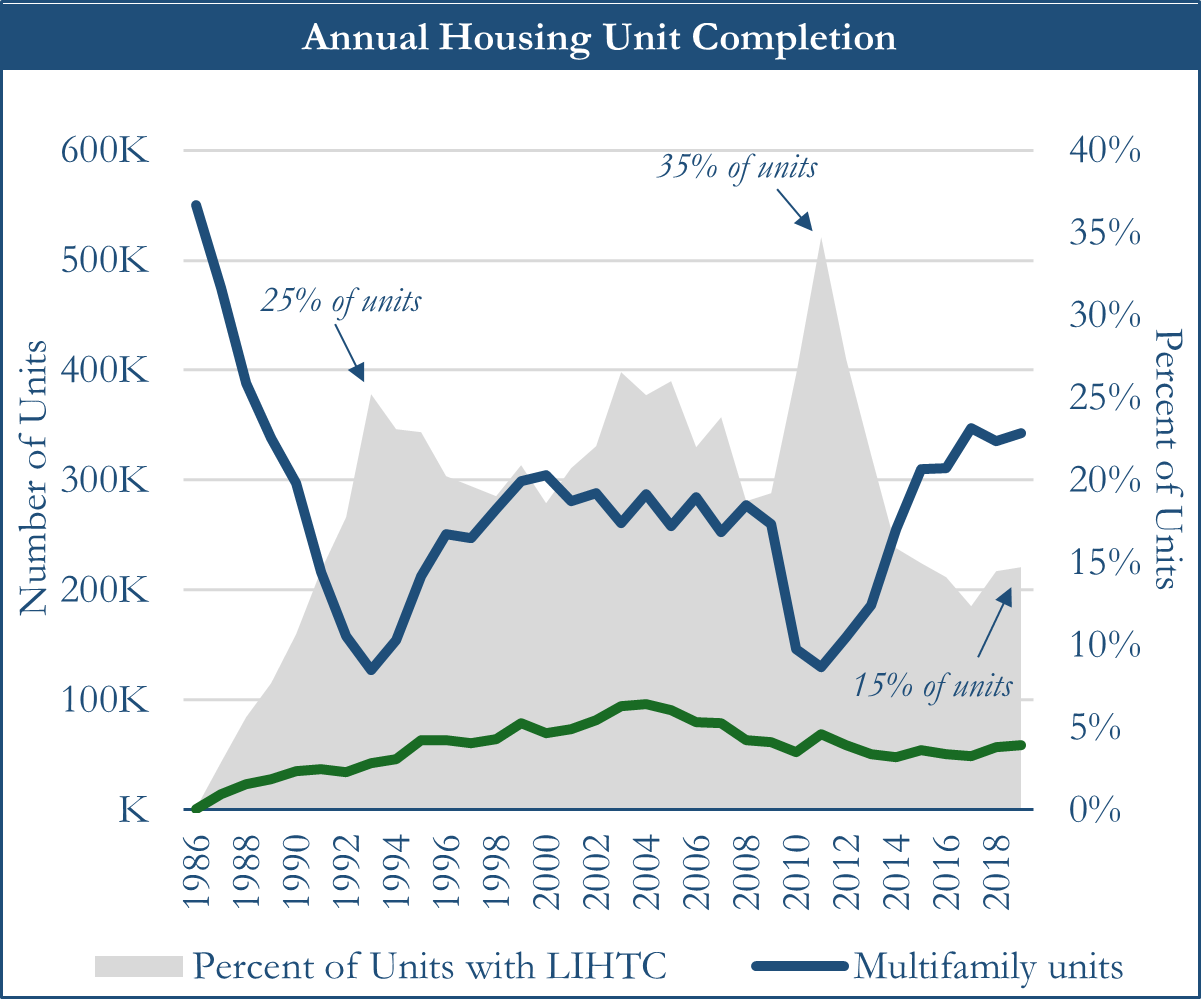
Source: Urban Institute. The US Census Survey of Construction (2023) and the National Housing Preservation Database (2023)
The LIHTC program offers two primary types of tax credits: 9% credit and 4% credit. The 9% credit finances up to 70% of an affordable housing development’s eligible costs, but there is an annual allocation limit to the distribution of 9% credits. The 9% credit allocation is based upon each state’s population and is adjusted annually for inflation. In 2024, the maximum allocation was the greater of $3,360,00 or $2.90 per capita [15]. Conversely, the 4% credit covers up to 30% of a project’s eligible costs and is used with projects that receive tax-exempt bond financing on at least 50% of the total project cost. There is not a limitation on the annual distribution of 4% credits, however, the amount of tax-exempt bonds issued in a year is limited. After a tax credit is awarded to a private developer, the developer will seek to sell the tax credit to a private investor as the investor is then able to reduce their income tax liability dollar-for-dollar.
ORG believes that implementing less restrictive governmental policy and increasing supportive funding can facilitate material growth in the LIHTC program. Currently, the Internal Revenue Service (“IRS”) allocates a set amount of tax credits for state and territorial governments to distribute to private developers within the year. However, there have been several state housing agencies that do not fully utilize their LIHTC allocation, which is then redistributed to other states after two years of disuse [16]. ORG believes that permitting states with unused allocations to transfer their surplus to states that have maximized their use of available credits within the current year will benefit the program and further increase supply of affordable housing. Additionally, tax credits awarded to affordable housing developments are capped at 9% of the project cost per year over a ten year period, and the program could be expanded by restoring the 12.5% temporary increase to the allocation ceiling which was effective from 2018 to 2021. The federal government may also extend the program by lowering the aggregate basis of the building and land that must be financed with tax-exempt bonds subject to the private activity bond volume cap from 50% to 30%. Overall, it is crucial that the United States government streamlines the funding, allocation, application, bidding, obtainment and compliance processes involved with the LIHTC program.
Reliance on the Section 8 Program
The most prominent governmental rental assistance program is the Section 8 program beginning in the 1970s. Section 8 housing assistance is provided to low-income tenants by giving a monthly subsidy to their landlords which ensures that the tenant does not pay more than 30% of their household income on rent. Assistance can be “project-based” where the apartment units maintain the subsidy and the incoming tenant benefits from a decreased rental cost burden, or “tenant-based” where tenants can use a voucher anywhere vouchers are accepted by landlords. There has not been any new funding provided to project-based Section 8 housing since 1983 as the government has decided to continue the program via Housing Choice Vouchers.
Tenant-based or Housing Choice Vouchers are the primary mechanism for assisted housing as it serves more than 5.3 million people across 2.2 million households nationwide. Approximately 68% of Americans using a voucher are seniors, children or people with disabilities [17]. Despite the program’s efficacy and governmental backing, many landlords do not accept vouchers as they are not mandated to do so by local, state or federal law.
Annually, the federal government provides states with funding allocations for renewal vouchers and new vouchers which are then distributed by state and local public housing agencies. In order for a family to obtain a voucher, they must first apply and go through the pre-approval process. After application, families spend approximately 2.5 years on a waitlist before being awarded the voucher and must find appropriate housing within 60 days of receipt [18]. Long wait times are created as a result of inadequate program funding and delays in the application process.
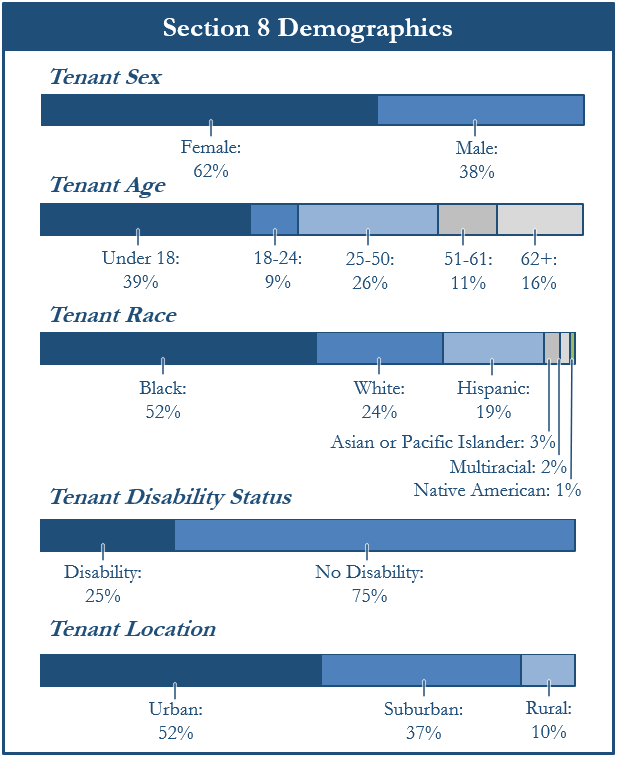
Source: CBPP analysis of HUD 2022 administrative data and the Housing Assistance Council’s urban, suburban, and rural Census tract designations (for location).
The Section 8 program has consistently received bipartisan support through Democrat and Republican presidential administrations, but there is a need for continued expansion of the program to further provide low-income families with housing stability and security. ORG believes that implementing a multi-year policy that consistently expands funding for renewal and new tenant-based vouchers will provide decent and affordable housing to an increasing number of families. The government should also consider reinstating funding for new project-based housing and develop a policy to increase funding levels annually.
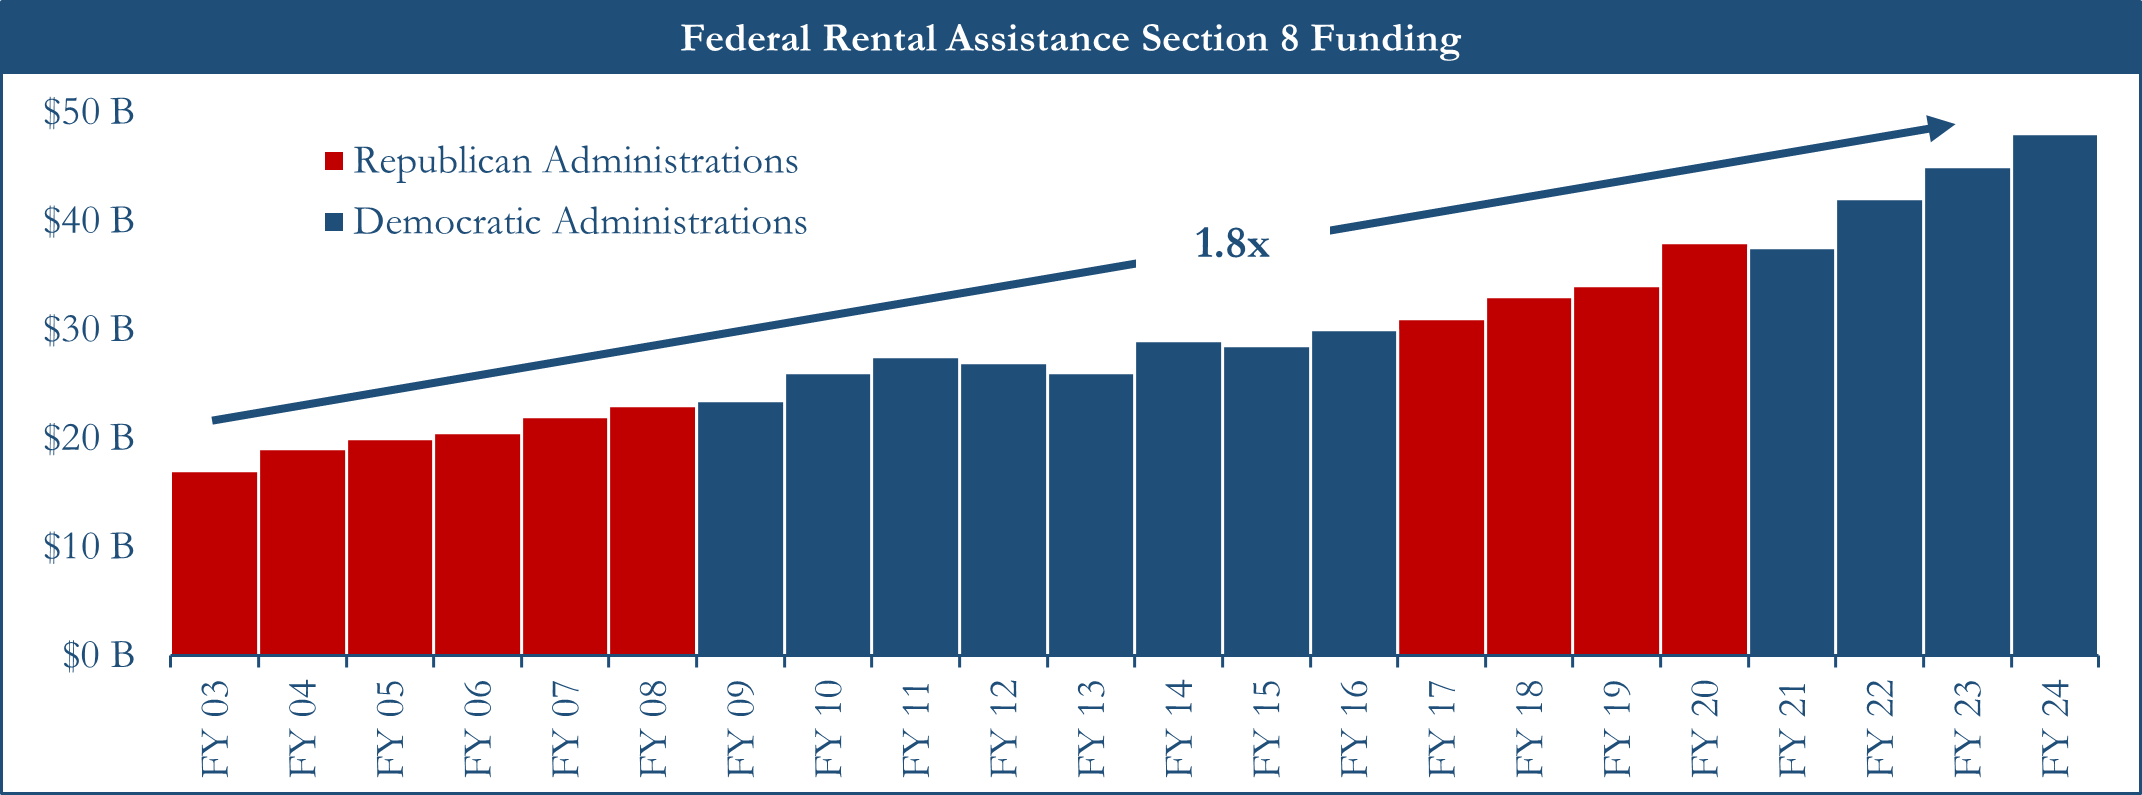
Source: CRS Reports; U.S. Department of Treasury
Investing in Affordable Housing through Qualified Opportunity Funds
Beginning in 2017 as part of the Tax Cuts and Jobs Act, the Opportunity Zone program was established to create an economic incentive for development in undercapitalized communities designated as Qualified Opportunity Zones. Commercial and industrial real estate, housing, infrastructure and existing or start-up business investments are eligible for preferential income tax treatment if the investment results in a “substantial improvement” of the asset [19]. The primary benefit of investing in a Qualified Opportunity Fund is that capital gains generated from the sale of an investment are 100% tax-free if the investment is held for a minimum of 10 years [20]. Additionally, investors can roll eligible capital or qualified 1231 gains from a recent realization into the fund to defer or avoid capital gains taxes, which generally range from 0-20% based upon overall taxable income [21].
In 2018, American governors nominated United States census tracts within their territory to be designated as Opportunity Zones and 8,764 census tract nominations have been confirmed by the IRS and United States Treasury [22]. Within the confirmations, 8,534 of 31,866 tracts defined as low-income areas received the Opportunity Zone designation [23]. Approximately 12% of the land in the United States is now part of an Opportunity Zone [24].
Although the Opportunity Zone program is intended to spur investment and job creation in challenged communities, the boundaries of Opportunity Zones have not been reassessed since their establishment in 2018 and often include areas that have progressed beyond requiring governmental support. Many Qualified Opportunity Funds continue to benefit from the tax incentives while deploying capital into economically positive environments as approximately 78% of total Opportunity Zone capital has gone to just 5% of tracts and 63% of tracts have received zero Opportunity Zone capital [25]. Furthermore, there are no requirements regarding the quality or type of product developed, prioritization of private financing over federal investment, or establishment of an oversight board to review projects [26]. Qualified Opportunity Funds are also able to invest up to 10% of the capital outside of an Opportunity Zone and still qualify for favorable tax treatment. As such, investors may improve or develop products that do not serve lower income populations and vastly misuse federal support intended to improve the economic development of communities. ORG believes that investments in Opportunity Zones do not directly impact housing affordability as the program is too widely applicable and prudent investors must consider Qualified Opportunity Fund investments independent of any tax advantages.
Investing in Affordable Housing
The Affordable housing sector has attracted a substantial level of interest from investors as the affordability crisis has continued to be exacerbated across the United States. When investing in Affordable housing, ORG believes investors should consider the following key questions:
1. Does investing in Affordable housing funds solve the affordable housing crisis?
2. Can investors generate attractive returns in Affordable housing funds?
3. How does an investor define success in Affordable housing investments?
Does Investing in Affordable Housing Funds Solve the Affordable Housing Crisis?
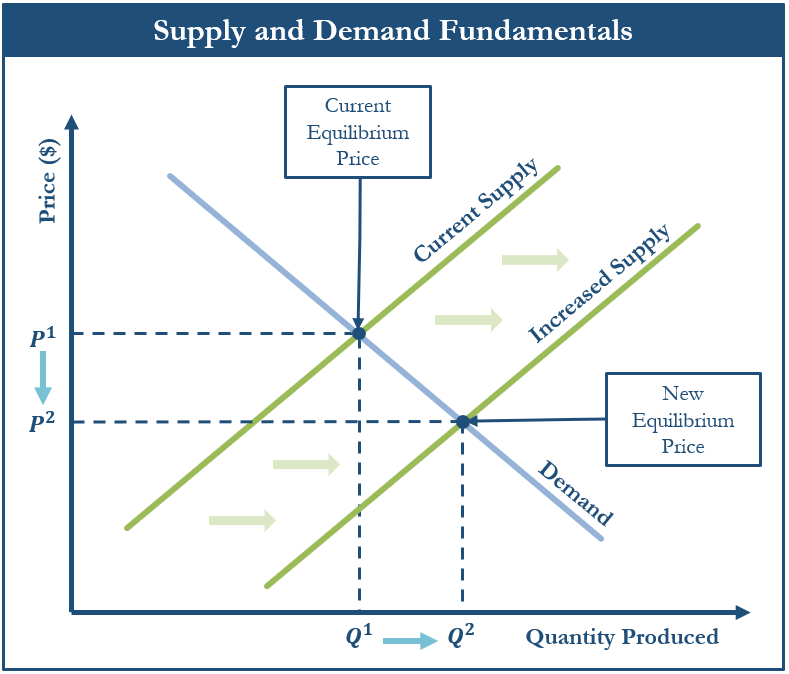
Based upon supply and demand fundamentals, housing affordability improves when unit production meaningfully increases. Supply and demand indicate that prices fall when the quantity produced increases, which can be applied to housing production and affordability. ORG firmly believes that the most effective way to improve housing affordability over the long-term is by increasing the total housing stock.
Investors seeking exposure to Affordable housing strategies are presented with funds that either invest in the preservation of existing Affordable units, development of new Affordable units or a combination of both preservation and development. Preservation strategies often acquire existing Affordable housing projects and maintain their status as Affordable and therefore do not increase the supply of Affordable housing.
Increasing the supply of Affordable housing has been severely challenged by rising construction and financing costs, restrictive local zoning regulations and material execution risk. Approximately 75% of the residential land in United States cities is zoned as single-family residences [27] and developers must receive a recommendation from the local zoning board and attend a public hearing to rezone a site for other more cost-effective developments such as townhomes or multi-unit buildings. Within the rezoning process, community residents and homeowners will often oppose new Affordable housing developments through NIMBYism, which stands for Not in My Back Yard, adding an additional obstacle for new development to overcome. Furthermore, Affordable housing development requires coordination at the federal, state, and local and private level to successfully execute new projects. Since development relies on tax credits or other assistance programs, projects are often elongated, stalled or shut down as working with all levels of the government can be a slow and cumbersome process.
Can Investors Generate Attractive Returns in Affordable Housing Funds?
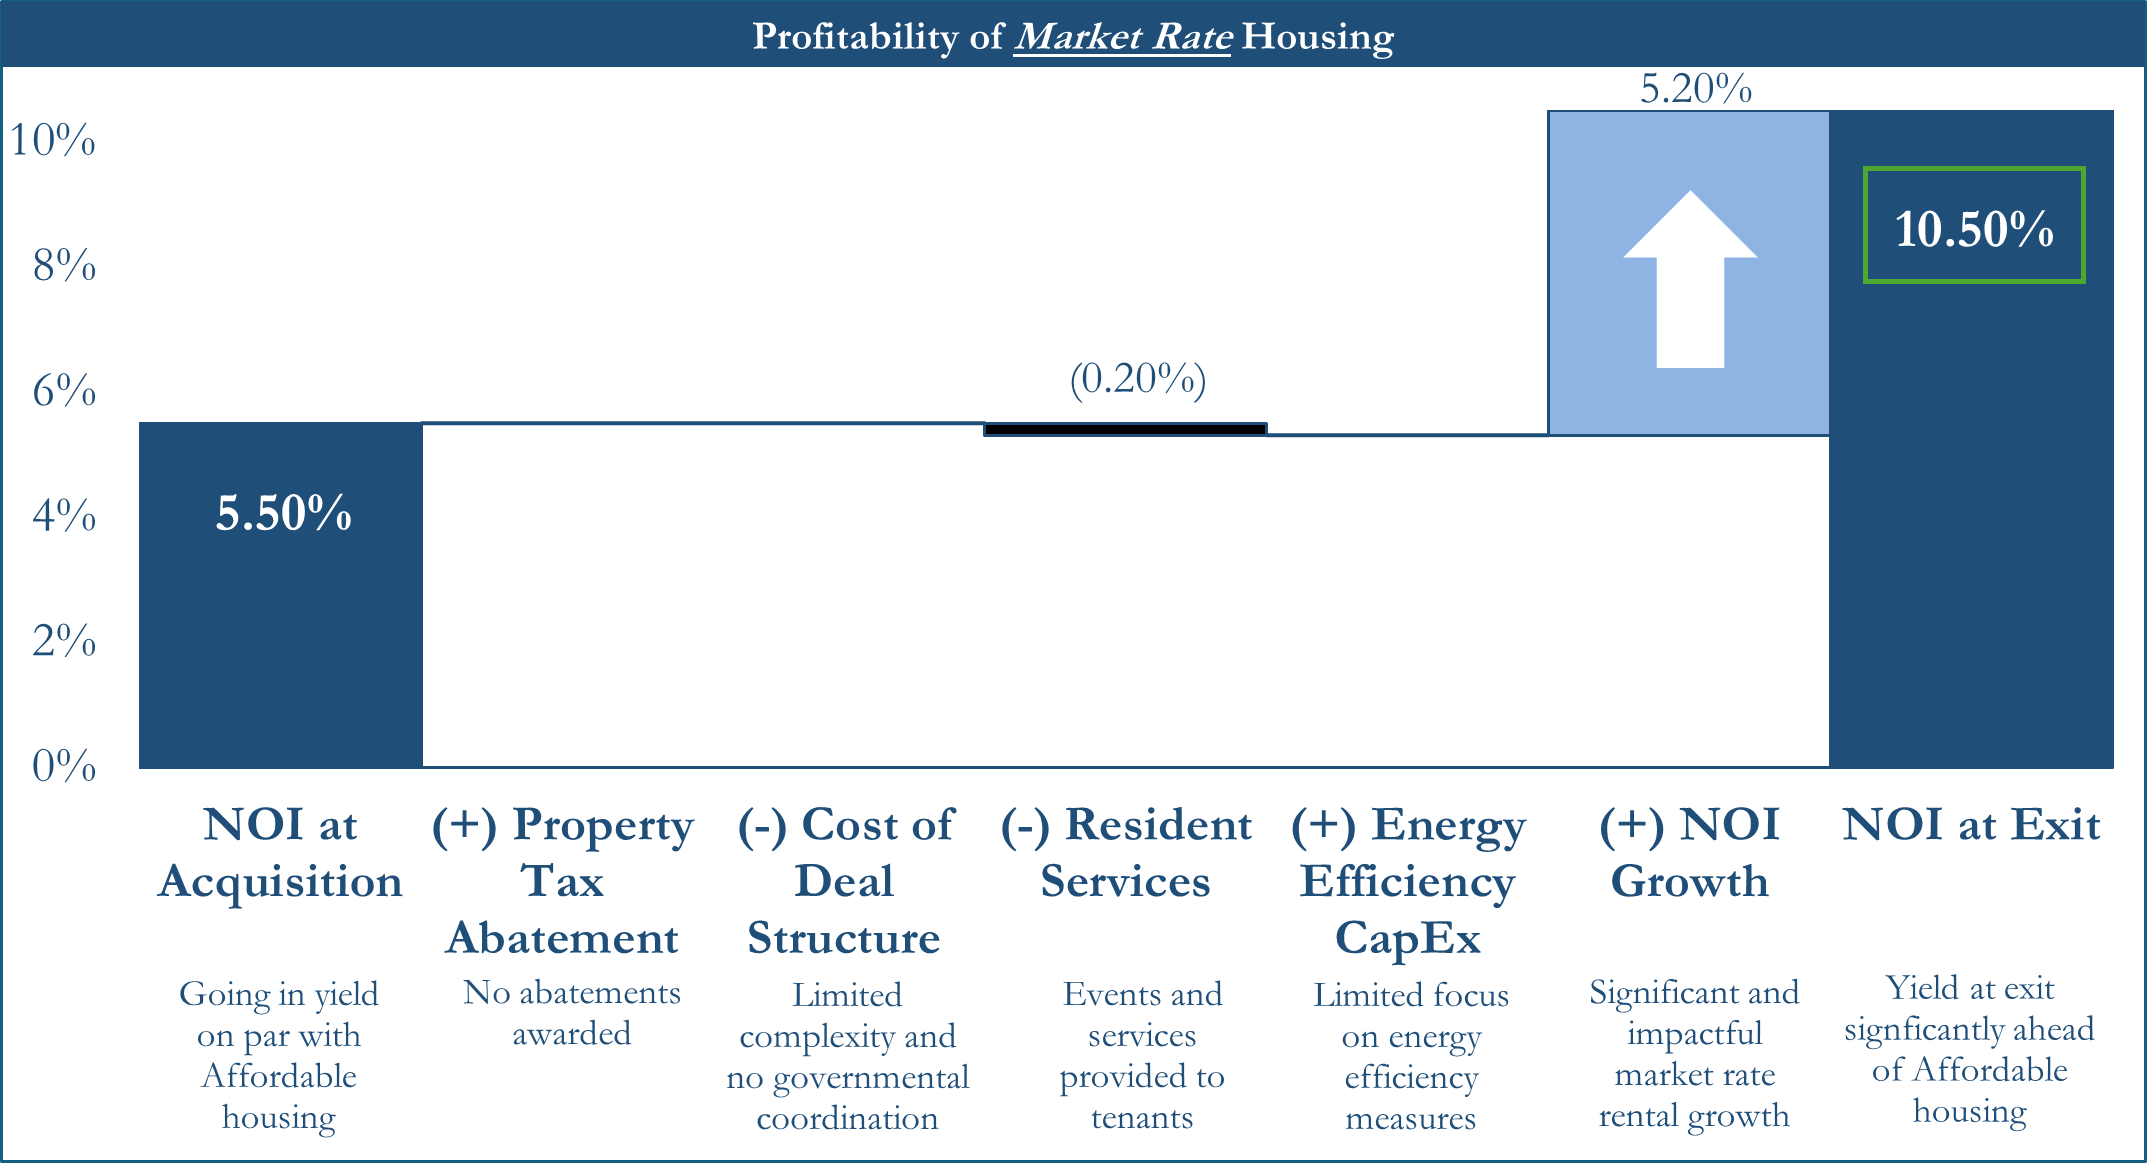
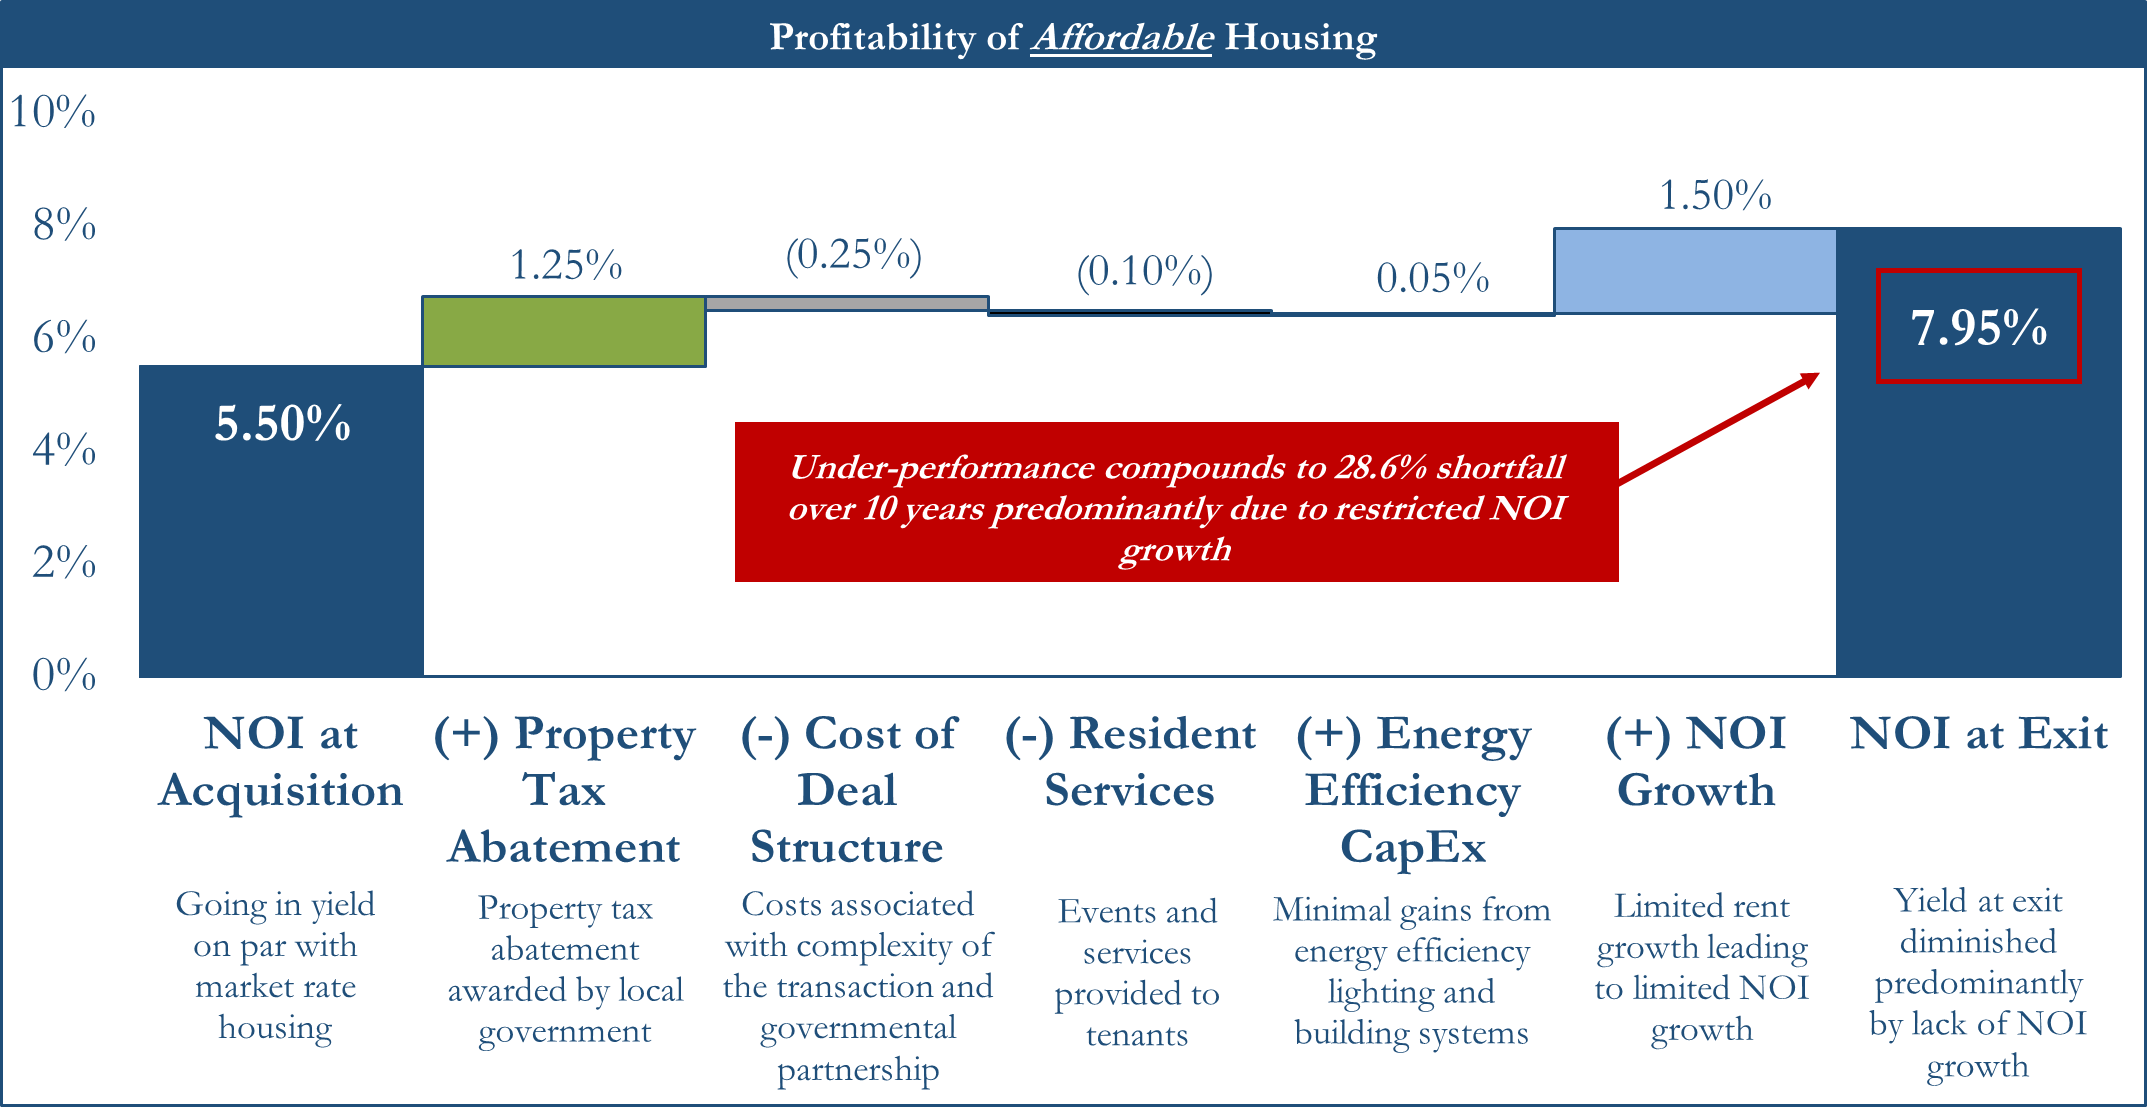
One of the primary economic drivers of interest in Affordable housing investments is the “stickiness” of the tenants as many have dedicated years to obtaining a voucher and are reluctant to move. Because of this, the assets are often considered to have consistently strong occupancy. Governmental assistance is also frequently marketed as an additional boost to investment returns. However, the profitability of Affordable housing investments is significantly below its market rate counterpart as governmental incentives do not substitute market rate rental growth over the hold period of an asset.
In conjunction with the detrimental effect of limited net operating income growth, Affordable housing investments have been severely impacted by persisting market headwinds. Generating attractive returns in Affordable housing has become increasingly difficult due to elevated entry prices with limited growth, the continued rise in construction costs and the recent significant increase in the cost of financing.
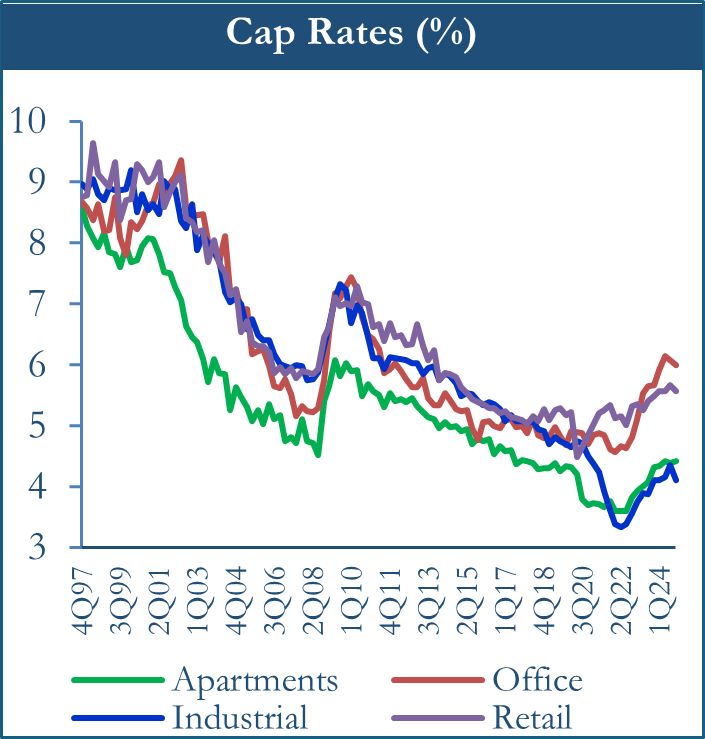
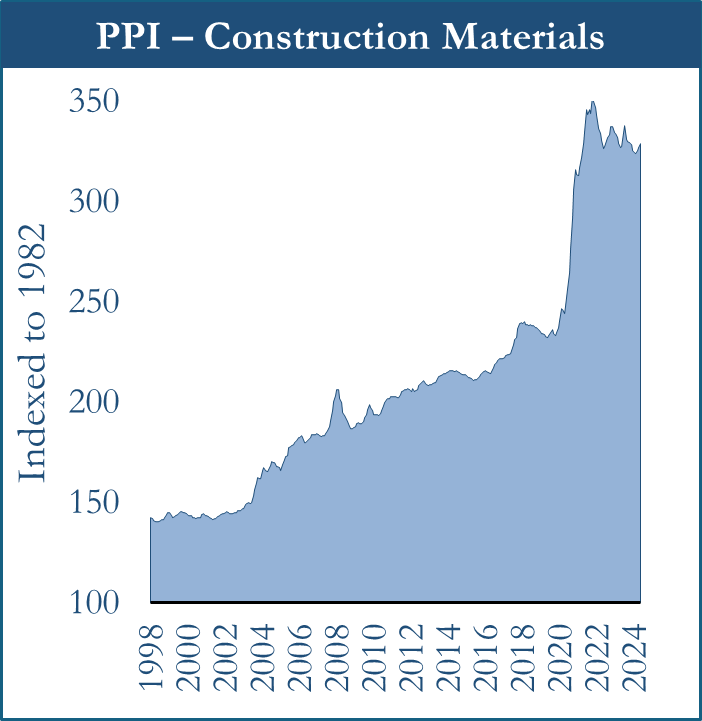
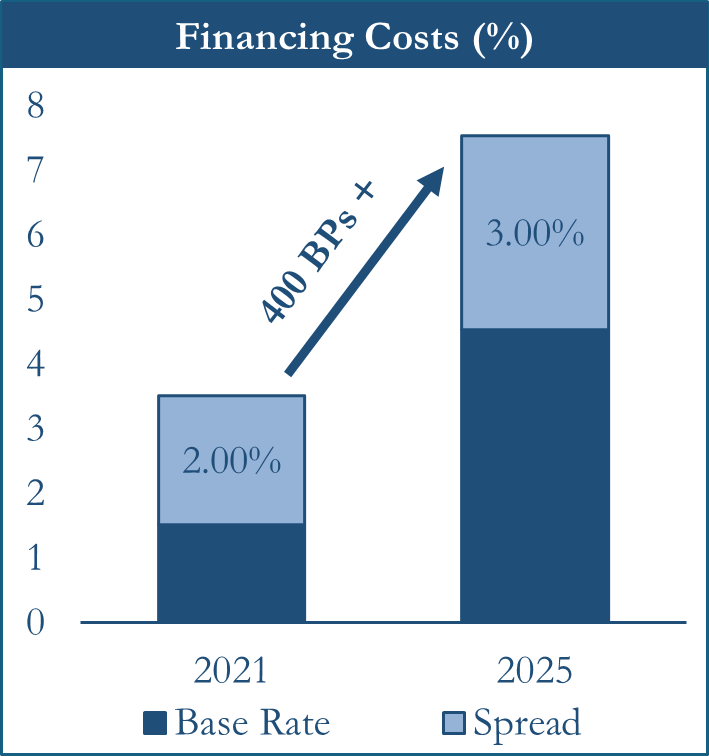
Sources: NCREIF NPI, US Census Data, Federal Reserve Economic Data
While traditional Affordable housing investments typically underperform their market rate counterpart, ORG encourages return driven investors seeking exposure to consider development opportunities in “lowercase a” affordable housing where they are able to generate more attractive returns while still impacting housing affordability. Although traditional Class B and Class C units are typically aged properties, workforce housing development offers an attractive substitute for Affordable housing with limited execution risk as these projects do not rely on government funding. Workforce housing is constructed at a cost basis significantly below Class A assets providing the opportunity to offer units at a more attainable rate while still retaining the ability to adjust rents to the market and achieve stronger returns.
How Does an Investor Define Success in Affordable Housing Investments?
For many investors, success is defined by generating strong returns while accomplishing the investment strategy. While it is understood that some investors may be impact driven, concessionary returns are often prohibited by an investor’s investment policy statement.
Given that Affordable housing investments generally do not achieve similar return thresholds as market rate housing, investors seeking to deploy capital must exercise a high degree of selectivity and prudence when investing in the sector. Although limited, ORG believes that attractive opportunities in Affordable housing can exist when investors have a clear line of sight into the assets in which they are investing. Investment returns may also be boosted by creative structures such as co-investment offerings and program-related investments where an investor can receive more favorable terms and express greater control over where capital is allocated.
Alternatively, ORG believes that advocacy plays an important role throughout the entire Affordable housing sector. ORG encourages those looking to make an impact on the affordability crisis to engage with local agencies to advocate, contact elected officials to improve awareness, increase funding and influence policy and legislation, and partner with local foundations to increase supply.
Conclusion
The United States has been facing a substantial shortage of affordable housing for several decades predominantly due to limited new supply and inflation in housing related costs. Supply and demand fundamentals emphasize that the most effective way to ease the affordability crisis is to increase supply of the overall housing stock. However, investment returns in development of Affordable housing have been challenged by delays due to restrictive zoning and NIMBYism, rising construction costs, inflated entry prices and elevated financing costs. In combination with the aforementioned obstacles, ORG believes that governmental assistance through programs such as LIHTC and Section 8 do not substitute rental growth seen in traditional market rate housing. Investors seeking exposure to Affordable housing must carefully review investment opportunities to identify the best course of action based upon satisfactory returns and increasing supply.
[1] “Study Shows Massive Shortage of Affordable and Available Housing for Lowest Income Households in America.” National Low Income Housing Coalition, 2 Mar. 2017, nlihc.org/news/study-shows-massive-shortage-affordable-and-available-housing-lowest-income-households-america.
[2] Bureau, US Census. “Population.” Census.Gov, 8 Nov. 2024, www.census.gov/topics/population.html.
[3] Housing-Cost Burden among U.S. Renters, www.irp.wisc.edu/wp/wp-content/uploads/2024/09/Focus-on-Poverty-40-1d.pdf.
[4] Housing-Cost Burden among U.S. Renters, www.irp.wisc.edu/wp/wp-content/uploads/2024/09/Focus-on-Poverty-40-1d.pdf.
[5] DeSilver, Drew. “A Look at the State of Affordable Housing in the U.S.” Pew Research Center, Pew Research Center, 25 Oct. 2024, www.pewresearch.org/short-reads/2024/10/25/a-look-at-the-state-of-affordable-housing-in-the-us/.
[6] How Are Low-Income and Very Low-Income Determined? - Hud Exchange, www.hudexchange.info/faqs/crosscutting-requirements/section-3/general/how-are-low-income-and-very-low-income-determined/.
[7] U.S. Census Bureau, Housing Inventory Estimate: Total Housing Units in the United States [ETOTALUSQ176N], retrieved from FRED, Federal Reserve Bank of St. Louis; https://fred.stlouisfed.org/series/ETOTALUSQ176N.
[8] “Assisted Housing: National and Local.” Assisted Housing: National and Local | HUD USER, www.huduser.gov/portal/datasets/assthsg.html.
[9] “Section 2: Today’s Low-Income America.” The Justice Gap Report, 25 Apr. 2022, justicegap.lsc.gov/resource/section-2-todays-low-income-america/.
[10] “The Gap.” National Low Income Housing Coalition, nlihc.org/gap.
[11] “Study Shows Massive Shortage of Affordable and Available Housing for Lowest Income Households in America.” National Low Income Housing Coalition, 2 Mar. 2017, nlihc.org/news/study-shows-massive-shortage-affordable-and-available-housing-lowest-income-households-america.
[12] “Preserving Long-Term Affordability in LIHTC Housing.” Bipartisan Policy Center, bipartisanpolicy.org/blog/preserving-lihtc-housing/.
[13] “Low-Income Housing Tax Credit Fact Sheet.” NMHC, www.nmhc.org/advocacy/issue-fact-sheet/low-income-housing-tax-credit-fact-sheet/.
[14] Mendoza, Candyd. “Thousands of Affordable Housing Units to Vanish as LIHTC Protections Expire.” Mortgage Professional, Mortgage Professional, 7 Oct. 2024, www.mpamag.com/us/mortgage-industry/industry-trends/thousands-of-affordable-housing-units-to-vanish-as-lihtc-protections-expire/508556.
[15] IRS, www.irs.gov/pub/irs-drop/rp-23-34.pdf.
[16] Huq, Nushin, et al. “Understanding State LIHTC Allocations.” Tax Credit Advisor, 8 Mar. 2024, www.taxcreditadvisor.com/articles/understanding-state-lihtc-allocations/.
[17] Housing Choice Voucher Fact Sheets | Center on Budget and Policy Priorities, www.cbpp.org/housing-choice-voucher-fact-sheets.
[18] Families Wait Years for Housing Vouchers Due to Inadequate Funding | Center on Budget and Policy Priorities, www.cbpp.org/research/housing/families-wait-years-for-housing-vouchers-due-to-inadequate-funding.
[19] “Opportunity Zones Explained.” OpportunityZones.Com, 25 Jan. 2024, opportunityzones.com/guide/opportunity-zones/.
[20] “What Are Opportunity Zones and How Do They Work?” Tax Policy Center, taxpolicycenter.org/briefing-book/what-are-opportunity-zones-and-how-do-they-work.
[21] “Topic No. 409, Capital Gains and Losses.” Internal Revenue Service, www.irs.gov/taxtopics/tc409.
[22] “Opportunity Zones Explained.” OpportunityZones.Com, 25 Jan. 2024, opportunityzones.com/guide/opportunity-zones/.
[23] Urban, www.urban.org/sites/default/files/publication/98445/did_states_maximize_their_opportunity_zone_selections_1.pdf.
[24] “Opportunity Zones Map: Where Opportunity Zones Are Located.” OpportunityZones.Com, 25 Jan. 2024, opportunityzones.com/guide/opportunity-zones-map/.
[25] Kennedy, Patrick and Wheeler, Harrison, Neighborhood-Level Investment from the U.S. Opportunity Zone Program: Early Evidence (April 15, 2021). https://dx.doi.org/10.2139/ssrn.4024514
[26] “What Are Opportunity Zones and How Do They Work?” Tax Policy Center, taxpolicycenter.org/briefing-book/what-are-opportunity-zones-and-how-do-they-work.
[27] “Rethinking Zoning to Increase Affordable Housing.” The National Association of Housing and Redevelopment Officials (NAHRO), 17 Jan. 2024, www.nahro.org/journal_article/rethinking-zoning-to-increase-affordable-housing/.